Life science communicators’ guide to making the most of your quarterly analytics

Biotech is a data-driven world. Yet biotech communicators can sometimes struggle to derive insights – and formulate a plan of action – from their communications channel analytics.
What metrics are most indicative of a channel’s success? And, bigger picture, how can data be used in aggregate to prove the ROI of corporate communications?
Just in time for your Q2 wrap-up report, Waterhouse has compiled a primer for three common biotech communications channels – your corporate website, LinkedIn and company intranet – to identify which metrics are most meaningful, and why.
If you need support with your Q2 channel recap or if your data analytics surface a brand or reputation challenge, please reach out. Waterhouse is here to help.
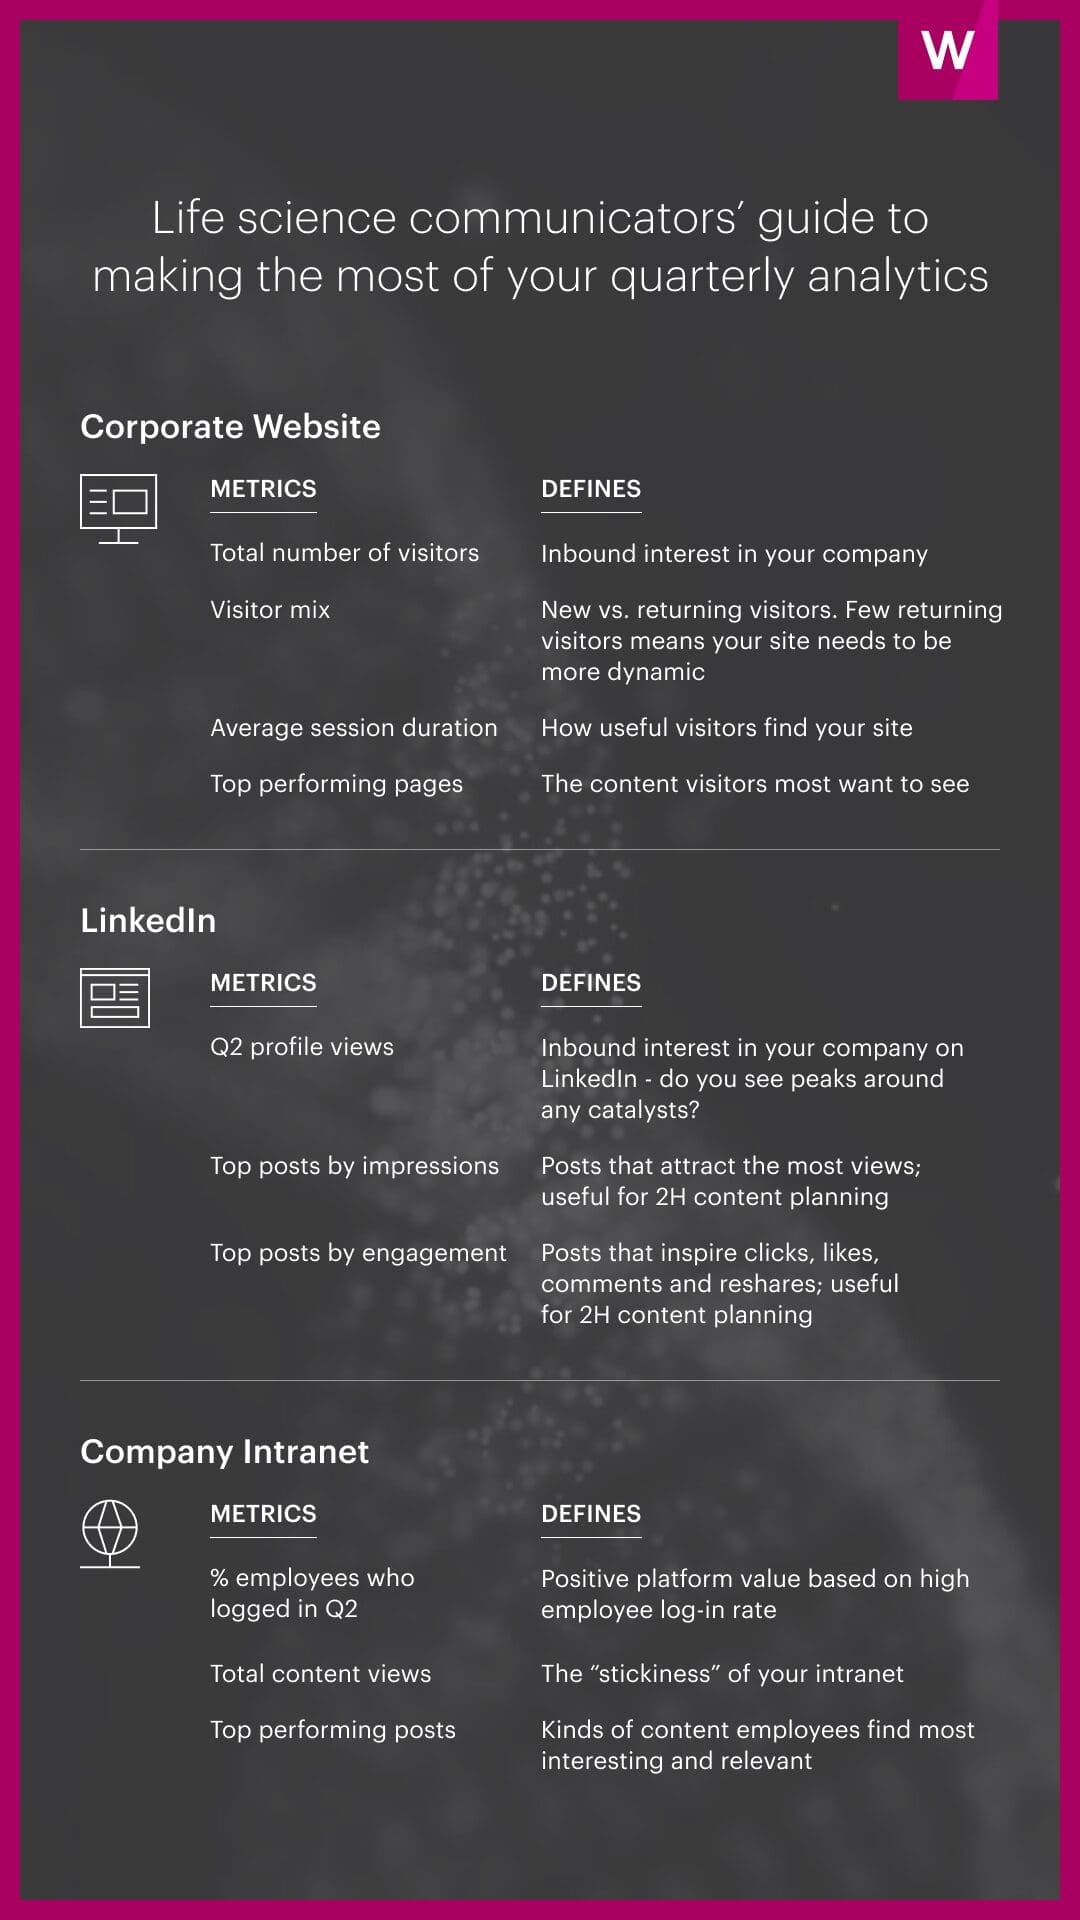
Corporate Website
| Metrics | Defines |
| Total number of visitors | Inbound interest in your company |
| Visitor mix | New vs. returning visitors. Few returning visitors means your site needs to be more dynamic |
| Average session duration | Useful information is on your site based on longer session lengths |
| Top performing pages | The specific content visitors most want to see |
| Metrics | Defines |
| Q2 profile views | Inbound interest in your company on LinkedIn – do you see peaks around any catalysts? |
| Top posts by impressions | Posts that attract the most views; useful for 2H content planning |
| Top posts by engagement | Posts that inspire clicks, likes, comments and reshares; useful for 2H content planning |
Corporate Intranet
| Metrics | Defines |
| % employees who logged in Q2 | Positive platform value based on high employee log-in rate |
| Total content views | The “stickiness” of your intranet |
| Top performing posts | Effective internal comms by defining the kinds of content employees find most interesting and relevant |
